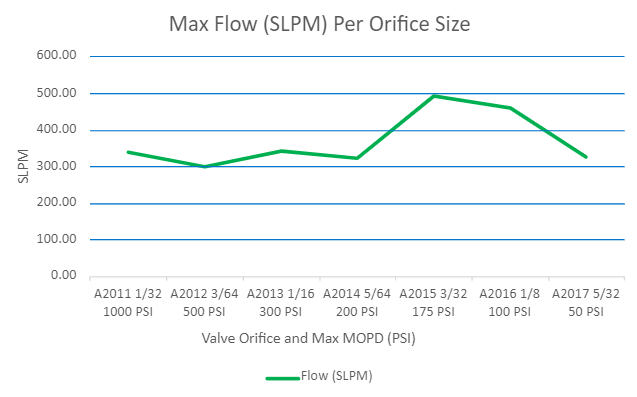
The below chart and graph shows the max flow rate through each orifice size, using the maximum amount of pressure allowed by the MOPD.
Pressures lower than the max MOPD will result in lower flow rates. Flow rates are calculated with room temperature air and ported bodies. Manifold Mount bodies will result in slightly lower flow rates due to more flow path turns.
| Prefix | Orifice | MOPD (PSI) | Flow (SLPM) |
| A2011 | 1/32 | 1000 | 339.73 |
| A2012 | 3/64 | 500 | 301.57 |
| A2013 | 1/16 | 300 | 342.43 |
| A2014 | 5/64 | 200 | 323.48 |
| A2015 | 3/32 | 175 | 492.23 |
| A2016 | 1/8 | 100 | 460.83 |
| A2017 | 5/32 | 50 | 324.93 |

 SEARCH OUR RESOURCE CENTER

